 version 1.19
# November 2017 (version 1.19) (opens new window)
Welcome to the November 2017 release of Visual Studio Code. As announced in the November iteration plan (opens new window), the focus this month was on GitHub issue clean-up, product performance, and data collection tools for better issue reporting.
During this iteration, we closed 4400 issues (either triaged or fixed) across all our VS Code repositories. As we busily closed issues, you did not stop filing new ones and you created around 2700 new issues. This resulted in a net reduction of around 1700 issues of which 1400 were in the main vscode repository (opens new window).
Bug fixes as well as community PRs still resulted in a great list of updates. Here are some of the release highlights:
- Performance (opens new window) - Faster startup and other performance improvements.
- Serviceability/Diagnostics (opens new window) - New VS Code diagnostics, logging, and extension monitoring.
- Smarter IntelliSense (opens new window) - IntelliSense remembers your previous suggestion choices.
- Better Tab layout (opens new window) - Tabbed headers can scale to fit the available space.
- Git side-by-side image diff (opens new window) - Git source control provider can display image changes side by side.
- Pipe output into VS Code (opens new window) - Easily view terminal output in a VS Code editor.
- New debugging recipes (opens new window) - Learn how to debug Next.js, Meteor projects and applications using the nodemon utility.
If you'd like to read these release notes online, go to Updates (opens new window) on code.visualstudio.com (opens new window).
You can also check out this 1.19 release highlights video (opens new window) from Cloud Developer Advocate Brian Clark (opens new window).
The release notes are arranged in the following sections related to VS Code focus areas. Here are some further updates:
- Workbench (opens new window) - Compare your active file to the Clipboard contents.
- Editor (opens new window) - Folding improvements, interval line numbers, support macOS global Clipboard.
- Languages (opens new window) - TypeScript 2.6.2, JSX fragment syntax, new JSON with comments mode.
- Debugging (opens new window) - Undefine env variables per session, better VARIABLES rendering.
- Extensions (opens new window) - Choose which extensions are active in your workspaces.
- Extension Authoring (opens new window) - Pre-release extension support, yo code can enable TSLint and checkJS.
# Logging (opens new window)
VS Code now creates activity log files which can help diagnose unexpected issues like crashes, delays, etc.. When running, VS Code creates four primary processes, main, shared, renderer and extension-host, and each process logs into its own log file. You can open each log file using the command Developer: Show Logs... which will open a process picker to select the specific process log file.

VS Code supports following log levels:
criticalerrorwarninfodebugtraceoff
By default, VS Code is configured with info level and logs info and the levels above (warn, error, critical). You can change the log level using the command-line argument --log.
--log <level>
    Log level to use. Default is 'info'. Allowed values are 'critical', 'error', 'warn', 'info', 'debug', 'trace', 'off'.
2
3
You can also turn off logging using the option --log off.
# --status command-line option (opens new window)
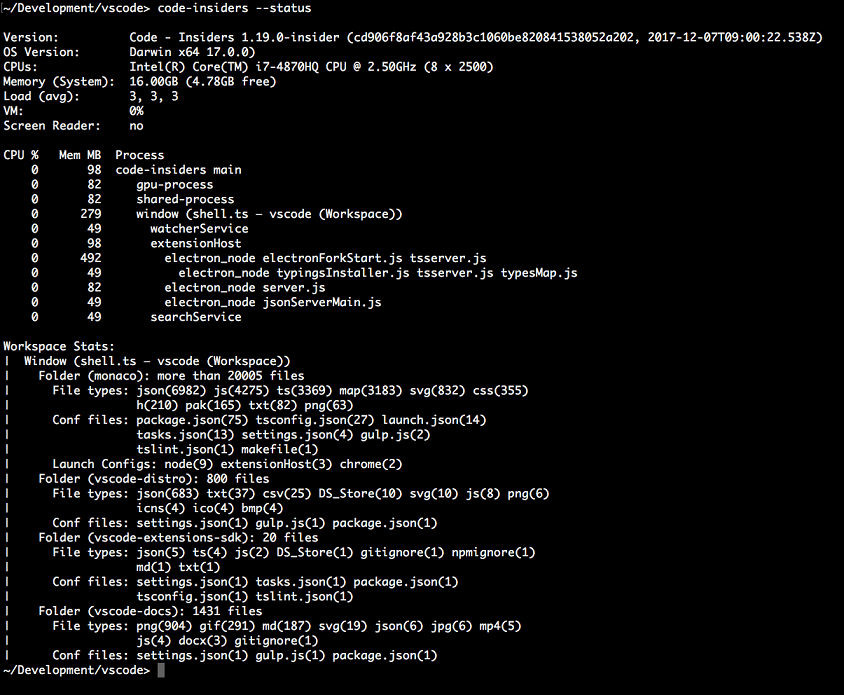
A new command-line argument was added which prints some useful VS Code diagnostics information to the terminal. You can share this information with us in GitHub issues and we will have a better understanding of the state of VS Code at the time of the issue.
Run code --status from the command line while another instance of VS Code is running and, after collecting status, you will see a display like this:

The output includes information about the environment, all running processes, and the counts of some common file types in the workspace.
# VS Code process view (opens new window)
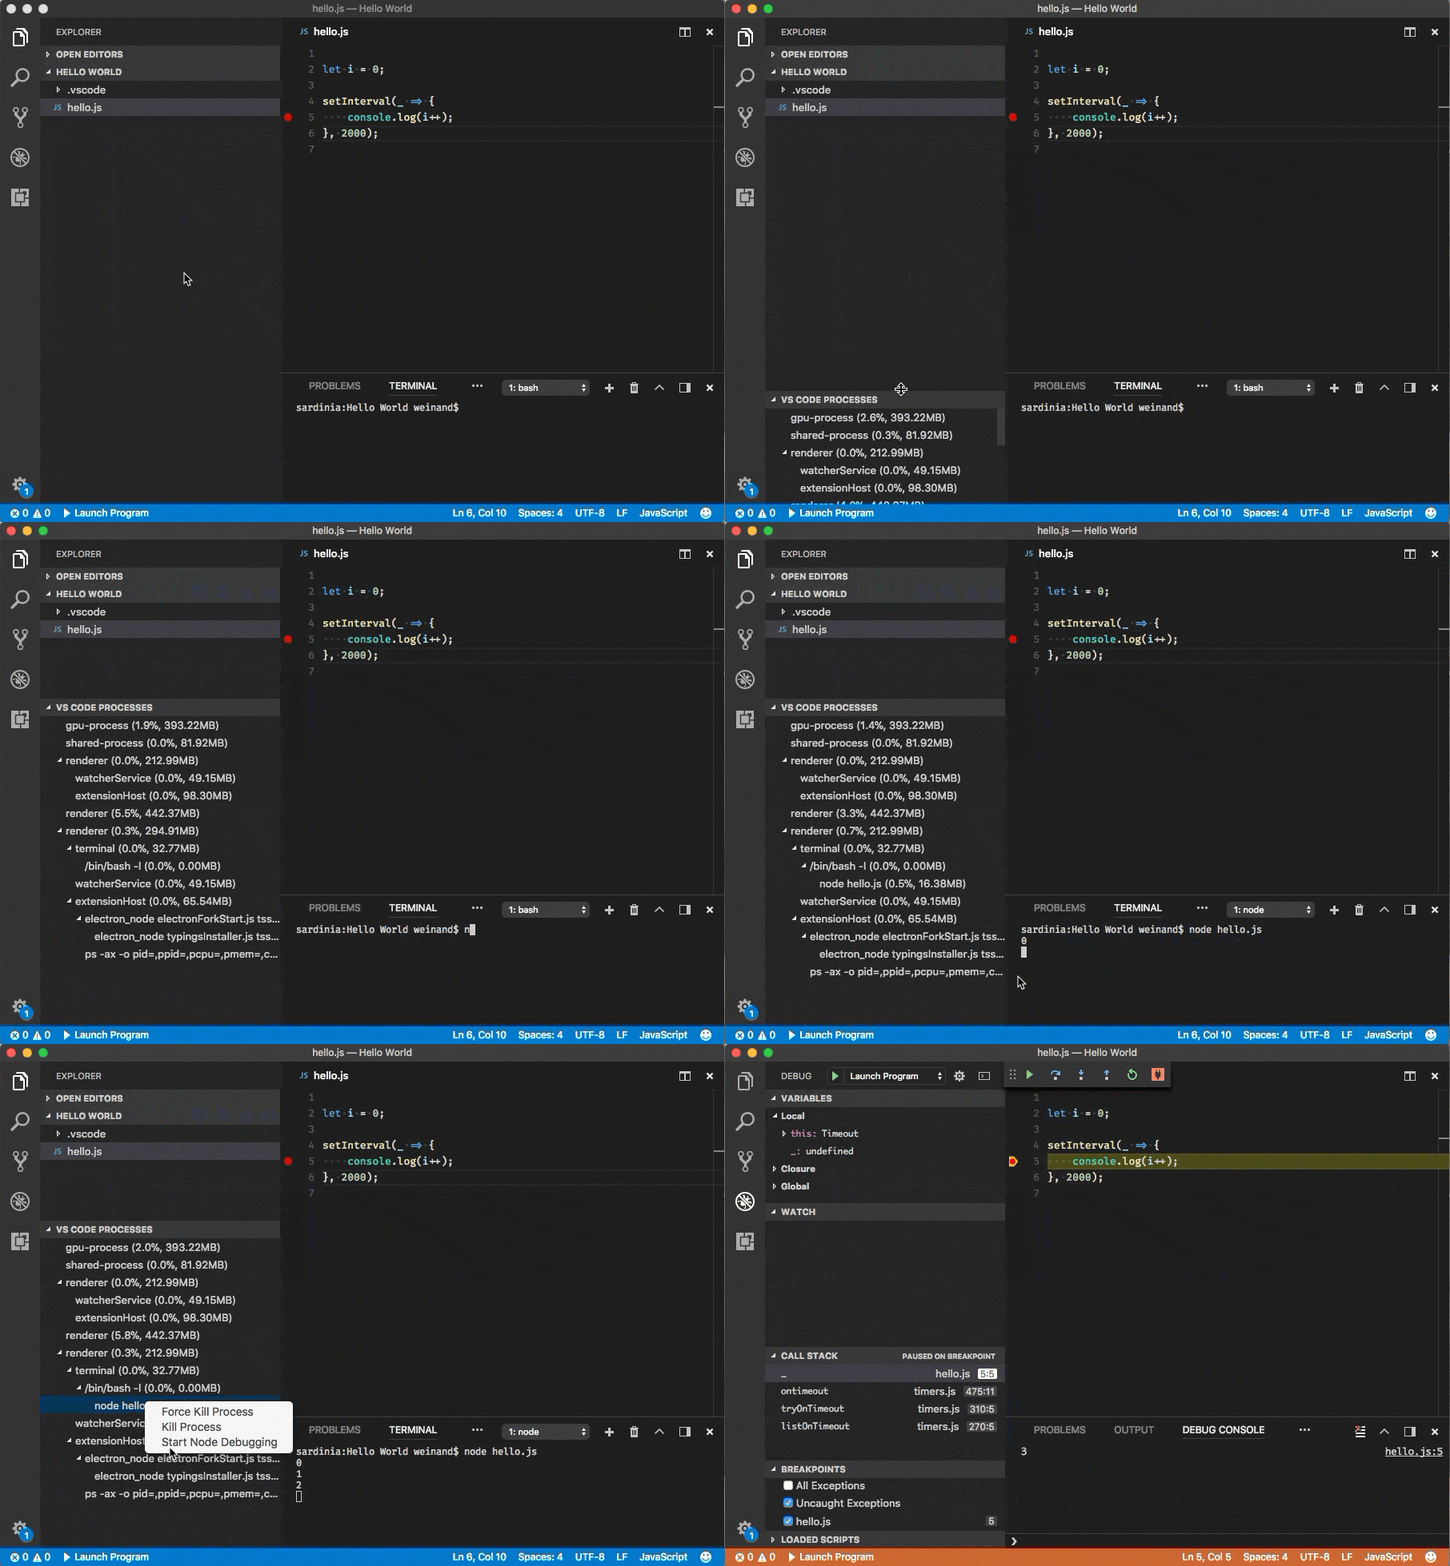
As a by-product of the new VS Code command-line option --status, we created an experimental extension vscode-processes (opens new window) that shows all child processes of VS Code in a custom view and dynamically updates as processes come and go. To better understand the role of those processes, the extension analyses the process arguments and labels the processes accordingly. The extension's CPU load and memory consumption is also shown in parentheses.

In addition, the extension tries to identify processes that can be debugged by VS Code itself and offers a debug action for those in the context menu. All processes can be terminated or killed from the menu as well.
This extension is still a prototype and so it is not yet available on the Marketplace but you can easily build the extension VSIX by running the following commands:
  git clone https://github.com/weinand/vscode-processes
  cd vscode-processes
  npm install
  npm run package
2
3
4
5
Once the extension VSIX is created, use VS Code's Install from VSIX... command to install the extension.
# Running extensions (opens new window)
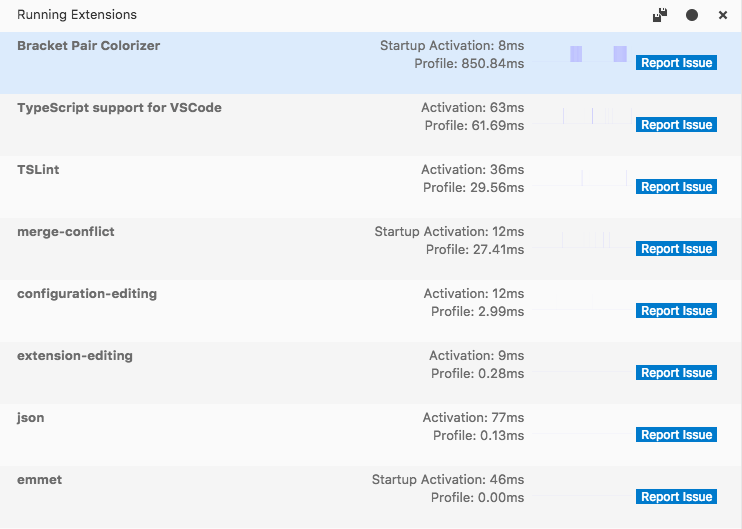
To make it easier for users to detect faulty or poorly performing extensions, we added a Running Extensions view. This view shows all the extensions which are currently running along with useful performance information. With this view, users can also profile VS Code in order to detect which extensions take the most time and are a likely cause of performance issues. Run the Developers: Show Running Extensions command from the Command Palette to see this view.

Note: The Running Extensions view is still under development so expect to see updates in future releases. We'd also appreciate your feedback.
- 01
- 搭配 Jenkins 实现自动化打包微前端多个项目09-15
- 02
- 自动化打包微前端多个项目09-15
- 03
- el-upload 直传阿里 oss 并且显示自带进度条和视频回显封面图06-05